Decided to put up a little data analysis from the last event of 2015 comparing 3 best lap data sets, one being my personal best ever from Sunday. Click the image for a full size view. Ill add to this as I have time over the next couple of days and play with the pictures to get them to show better.
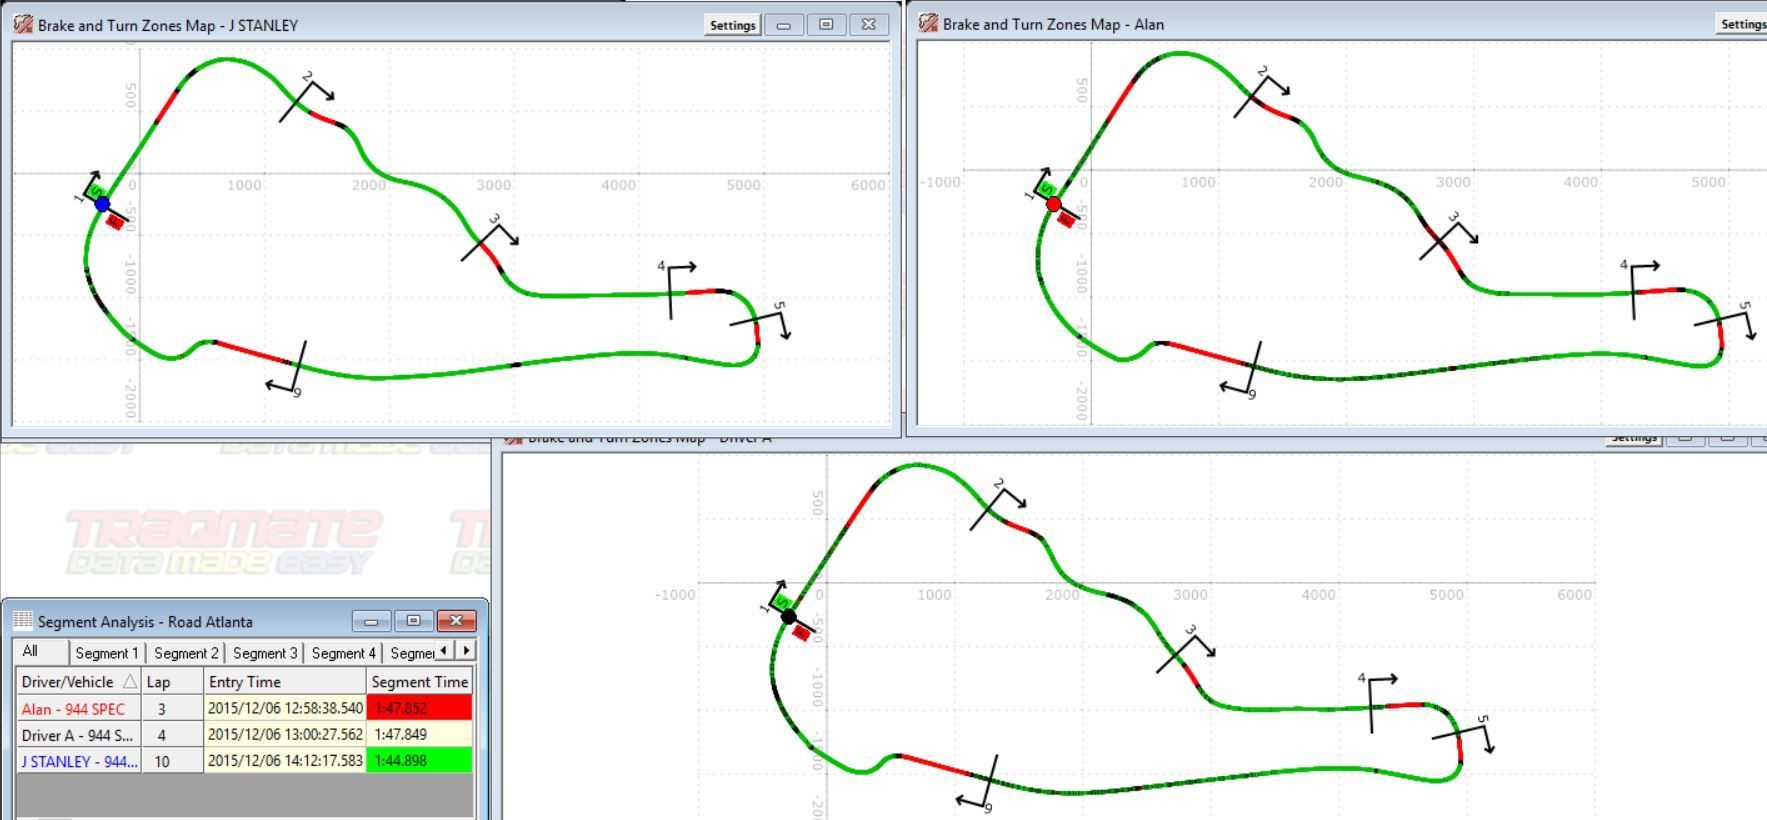
Brake and Turn Zone Map
Top Left: Stanley - 1:44.898
Top Right: Alan - 1:47.852
Bottom Center: Brian - 1:47.849
Beginning with just the brake and turn zone maps. Green means acceleration over .01g, red means braking over .2g, and black is everything else in between. Ideally you would like to see zero black anywhere on the map.
Some of the easiest differences to spot are the following:
Sector 1: Alan had most black between red and green. Brian broke the latest.
Sector 2: Downhill Esses - Solid green for Stanley all the way to the braking zone going into T5 with minimal black between green and red. Alan looks like he may be covering the brake or was slowed by traffic at the end of the esses.
Sector 4: Solid green through T6 for Stanley, but more black between red and green.
Sector 5: Solid green down back stretch for Stanley which I know was due to draft behind a SE30 which passed me early on the straight. Did Alan and Brian have a draft at all during these laps?
Sector 6: Alan had the most green in the sector but also the most black between the red and green.
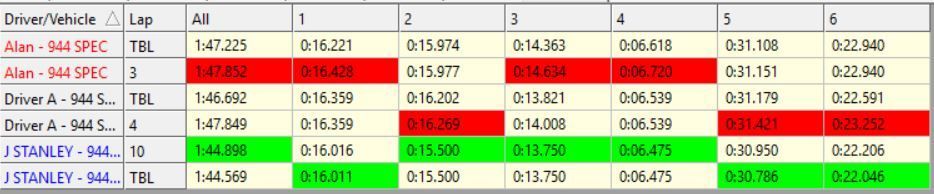
Segment Scoreboard
This compares the sector times for each driver for the selected lap. TBL is the theoretical best lap which pulls the best sector from the entire session and combines them into one lap. I am only comparing the sector times from each fast lap, but this shows how much faster you might have done the sector on another lap. Most of the TBL and fast lap sector times are fairly close (within a few tenths) for each driver. One that stands out is Brian's last sector with a 7 tenth difference telling me something happened in that sector.
Some of the biggest differences between fast and slow individual sector times are Sector 2 at 7 tenths, Sector 3 at 9 tenths, and Sector 6 at 1.2 seconds. Remember, Brian's last sector was likely a fluke as his TBL in Sector 6 was only 3 tenths slower but Alan was still 7 tenths slower.
Since we have found 3 sectors which have the biggest time to gain, Ill go into some segment specific analysis now to show how time can be improved.
Segment 3
Start with entry speed because this can make a huge difference right off the bat and is all dependent on how the previous sector went. Between fastest (S) and slowestv (A) there was a 14 mph difference! Look back at the brake and turn zone map to see how all that green Stanley had coming down the esses paid off.
Next look at average speed. With just over 5 mph between the fastest and slowest, this tells me that the rest of the sector was much closer speed wise especially if you look at the fact that Brian actually had the fastest exit speed and Alan was only 2 mph behind.
Lastly, look at min speed. Its easy to think this would be apex speed as that should be the slowest part of the corner. But, not all corners are perfect 90 degree textbook corners where you start accelerating again right at the apex, especially not T5 at Road Atlanta with all of its run off room on the exit. I actually found Apex Speed to be faster than min speed at T5 because of how the exit is handled jumping the curbing to let the car run wide. Looking at the speed vs distance graph in Traqview, apex speed was 75.7 (S), 73.9 ( B ), 68.8 (A). Min speed for this sector is then another 30 feet down the road when the car is hoping over the exit curbing and the tires are scrubbing more speed than the engine can overcome even if you are full throttle.
Given the minor differences after entry speed, I would say the run Stanley got down the esses was what made the biggest difference in his sector 3 time.